Fundamentals of electricity wholesale markets
This chapter provides a basic understanding of the fundamentals of electricity wholesale markets. This is done by outlining the scope, describing the demand and supply intersection, explaining market coupling, covering relevant technologies, distinguish dispatch from investment, and introducing frequently used units.
Scope
System
Electricity markets form key elements in the value chain for electricity as shown in the following figure.

The value chain of the electric power industry begins with the consumption of services and goods for electricity generation. This stage involves investing in economically viable generation technologies, constructing the facilities, and dispatching the assets to produce electricity. Generated electricity is then sold in wholesale markets, forming the next step in the value chain.
Wholesale markets facilitate the selling and buying of electricity in bulk, leading to commercial schedules for facilities. These markets optimize the power industry performance by coordinating market participants, grid operators, and their assets to maximize social welfare. In the subsequent retail market, electricity is resold in smaller volumes at higher prices, reflecting added taxes, levies, and fees. Together, wholesale and retail markets form the open market value chain.
In parallel to the markets, electrical grids ensure the physical transmission and distribution of electricity. Grid operators hold territorial monopolies since constructing multiple grids is not viable, so grid operators are regulated by agencies. These grid operators fulfill the market outcomes by enabling the physical flow of electricity based on the commercial schedules.
The final stage of the value chain involves investments and dispatches for consuming electricity in order to produce or consume other goods and services.
Time
Electricity markets impact dispatches and investments over a wide range of time frames. The figure below illustrates the time horizons involved in electricity markets.

The electric power industry plans investments decades ahead while estimating dispatches. These plans are revised in the long-term, mid-term, and short-term. The physical dispatch is mostly planned day-ahead and intraday.
Demand and supply
Spot market
The core market principle is to determine the price and volume through the demand and supply equilibrium, as shown in the figure below.

Demand and supply curves represent the aggregated bids of market participants and their specific technologies used for generation, consumption, and exchange. This aggregation implies that the market-clearing volume includes the schedule for each component (unit commitment).
The equilibrium between demand and supply in each bidding zone determines the price. On the supply side, the merit order represents the ranking of available generators by ascending variable cost, setting the order in which they are dispatched. Demand consists of both price-inelastic consumers, who are willing to pay any price, and price-elastic consumers, who adjust their consumption based on price changes. Generators with the lowest costs supply each additional required MWh until demand is met, with the last (and highest-cost) accepted bid setting the price and volume. This market-clearing price applies to all participants within the bidding zone.
Imports and exports between bidding zones, coordinated through market coupling, are incorporated into demand and supply curves (market coupling).
Balancing market
Similar to spot markets, prices and volumes in balancing markets, also known as frequency reserve markets, are set by supply and demand.
For example, in the European Union (EU), balancing markets typically include:
- Frequency Containm Reserve (FCR)
- Automatic Frequency Restoration Reserve (aFRR)
- Manual Frequency Restoration Reserve (mFRR)
In these markets, capacity is reserved in symmetric, positive, and negative generation power bands to maintain grid stability. The actual activation happens in real-time depending on the system imbalance.
Market coupling
Exchanges via interconnectors allow demand and supply to be shared across connected bidding zones, as illustrated in the figure below.

Exchanges represent commercial flows, typically moving electricity from lower-priced to higher-priced bidding zones, improving price convergence up to price equality. If the interconnector capacity is sufficiently large, prices fully converge, they equalize. If the capacity is insufficient, a price difference remains, as shown in the figure.
Interconnector capacities are determined by various capacity allocation methods in the market, such as net transfer capacities (NTC), coordinated net transfer capacities (CNTC), and flow-based market coupling (FBMC). These allocations create significant price and volume interdependencies between bidding zones and enhance total social welfare in the electricity wholesale market.
Technologies
The energy balance through technologies for generation and consumption can be seen in the following figure.
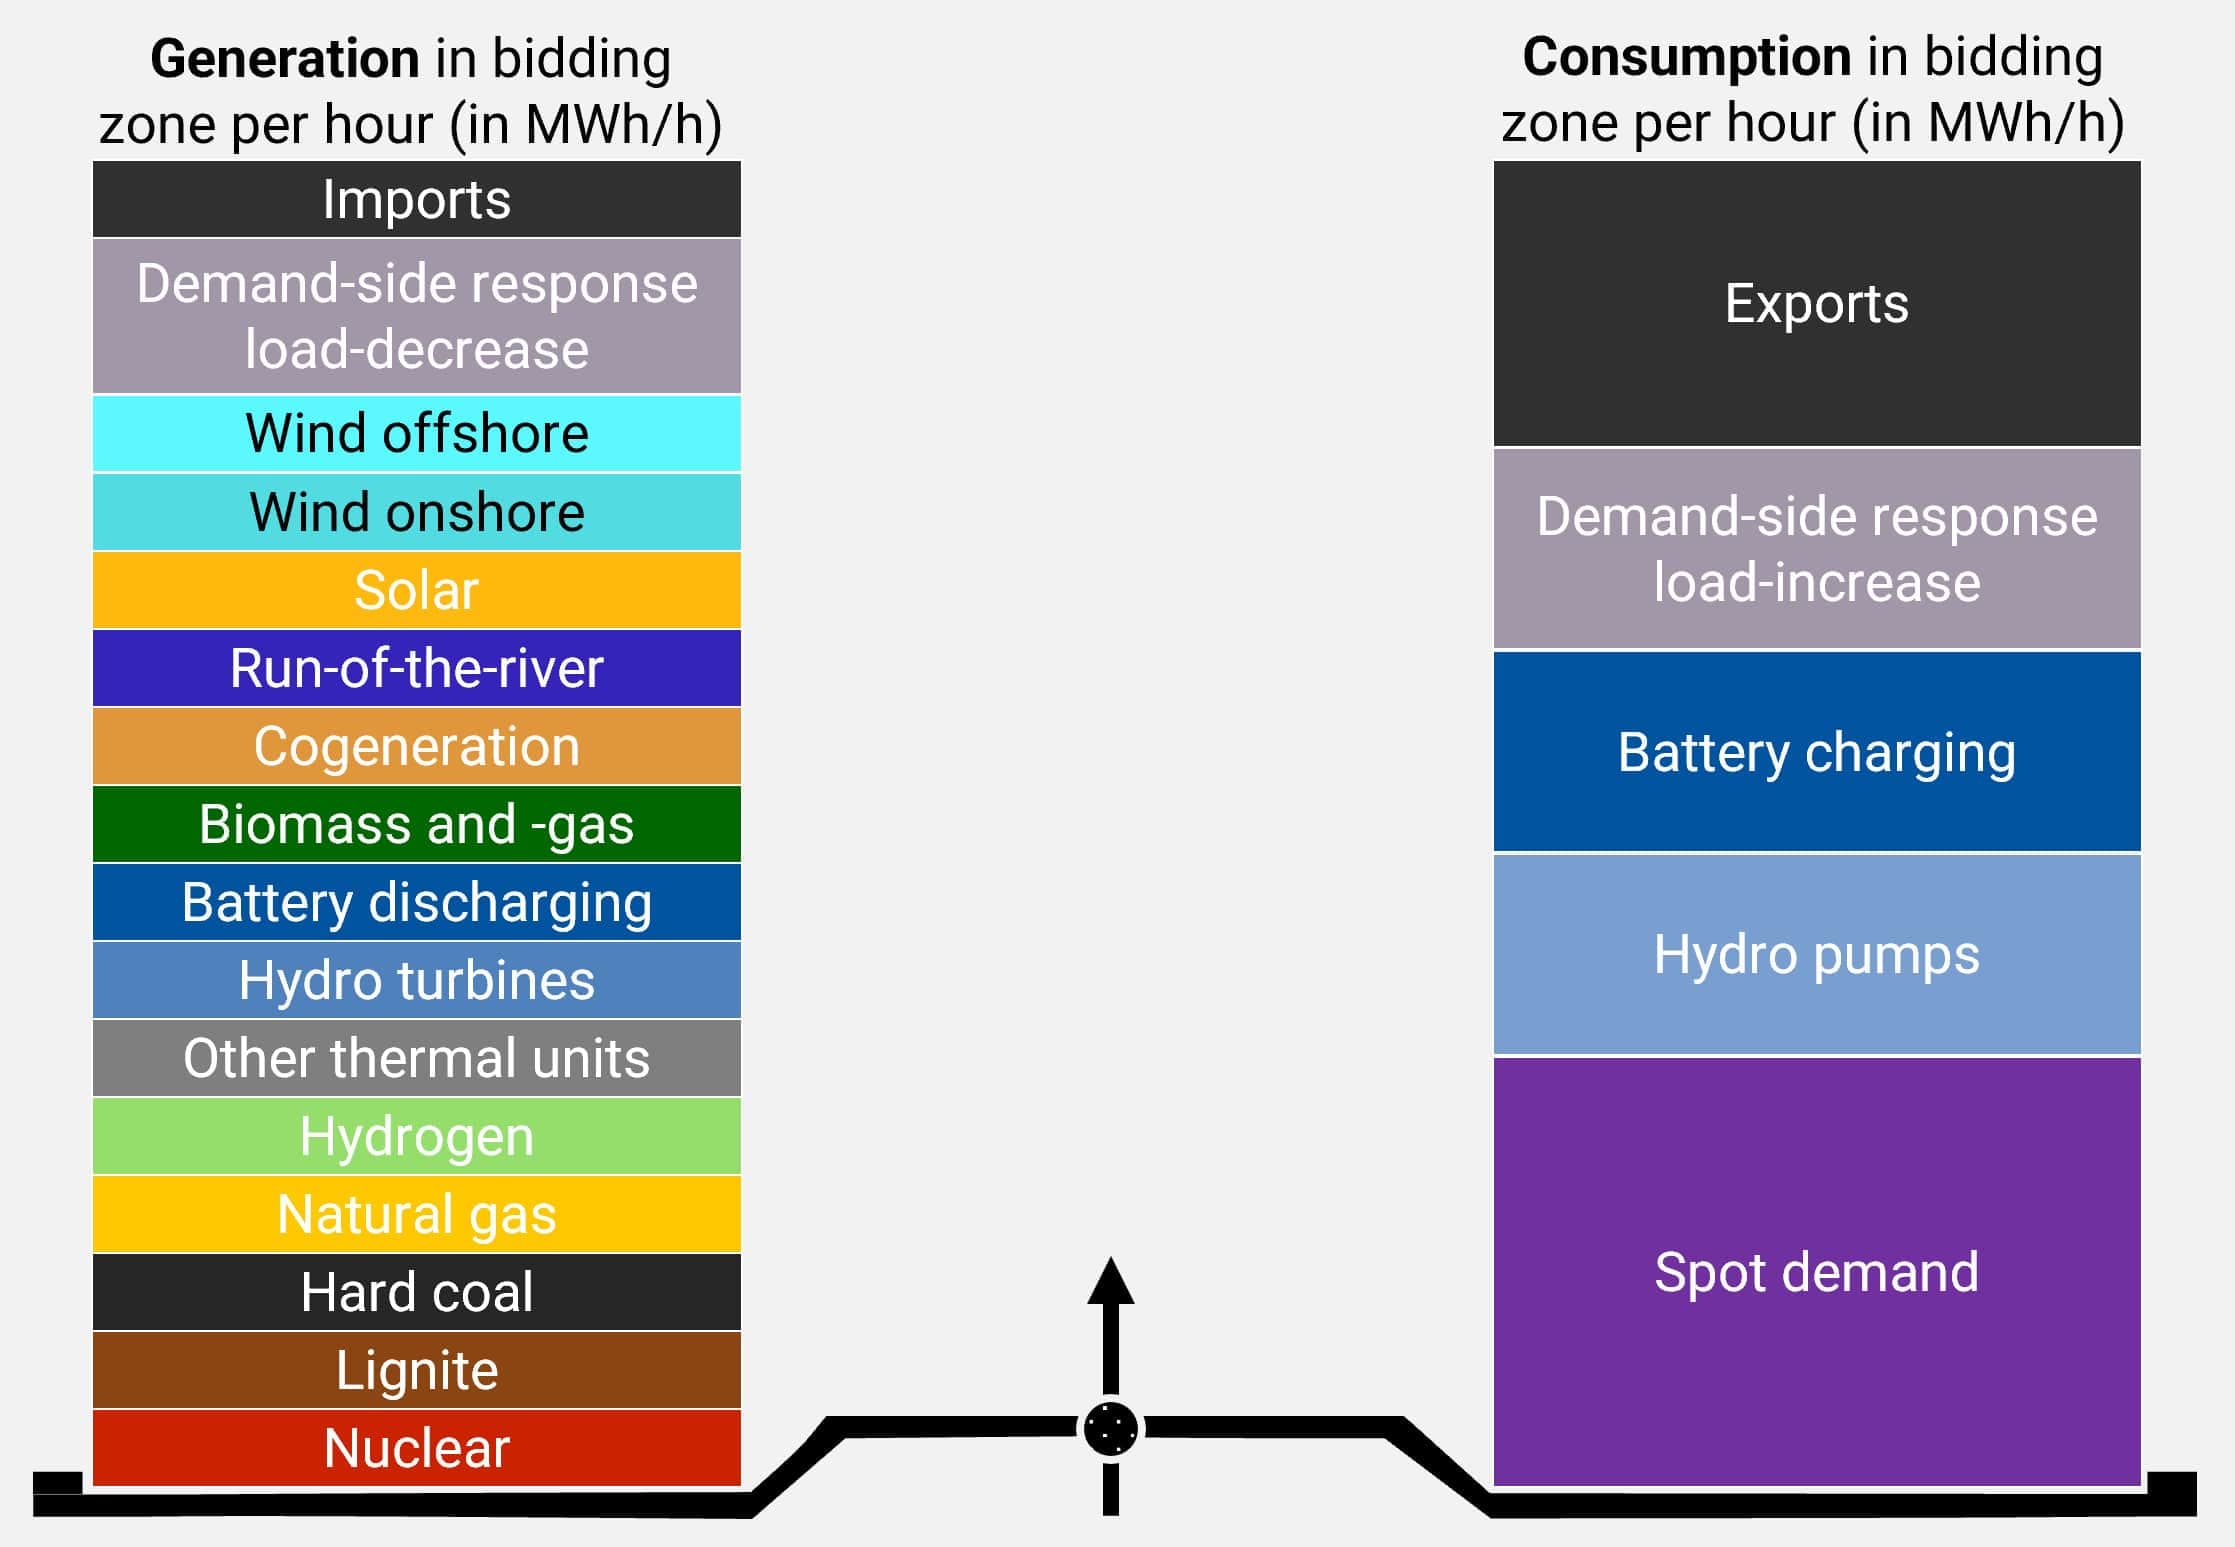
Due to the conservation of energy, electricity generation must match consumption at every moment. This balance also applies on a hourly or quarter-hourly basis within each bidding zone and can be represented in the market as an equilibrium equation. When the demand cannot equalize with available resources on the supply-side, the resulting deviation leads to either a surplus (dump energy) or a deficit (energy not served). The equilibrium in the market is collectively established by all market participants and their facilities, taking into account their business incentives as well as technological and operational flexibilities in investments and dispatches.
Price-inelastic consumers
Electricity consumption is driven by a diverse range of users, broadly categorized by their responsiveness to market prices. Price-inelastic consumers maintain their electricity usage regardless of price fluctuations, while price-elastic consumers adjust their consumption in response to market prices.
In addition to spot market demand, there is demand for frequency reserves, which include frequency containment reserves (FCR), as well as positive and negative automatic frequency restoration reserves (aFRR) and manual frequency restoration reserves (mFRR). Reserve market contributions involve the provision of electrical power, the capacity to generate or consume electrical energy on-demand, and its activation as electrical work in real-time. Reserve markets play a critical role in maintaining instantaneous demand-supply equilibrium, ensuring grid reliability and stability.
Price-elastic consumers
The price-elastic part of the demand is provided by demand-side response (DSR) consumers. DSR consumers can be for example the following.
- Electric air conditioning
- Electric heat pumps
- Electric storage heaters
- Electric vehicles
- Electrolyzers and methanation facilities
- Aggregated small-scale consumers reaching minimum wholesale market volumes
- Other flexible industrial consumers like aluminum, paper, steel and cement production facilities
Following image depicts DSR dispatch possibilities. Consumption can be adjusted in different ways: load-increase, load-decrease, and load-shifts in time. All load-adjustments can only occur within the range of the upside and downside potential. In case of shifts, the sum of single forward-shifts and backward-shifts is bound by the load-increase and load-decrease potential. Further, shifts can only occur within a predefined time-shift span (maximum shift).

DSR consumers can be active at the spot and frequency reserve markets. The DSR dispatch follows price incentives within specific technical and operational degrees of freedom. Load-shifters will have, for example, a load-decrease at higher spot prices and the counter load-increase at lower spot prices. Non-shifters, like load-decrease consumers, will be used as soon as the electricity spot price lies above their activation price.
Renewable energy sources
The feed-in of renewable energy sources (RES) can be originating, for example, from following producers.
- Biogas power plants
- Biomass power plants
- Concentrated solar power systems
- Geothermal power plants
- Marine power plants
- Micro cogeneration units
- Offshore wind turbines
- Onshore wind turbines
- Run-of-river power plants
- Solar panels
- Waste incineration power plants
RES power plants can be active at the spot and frequency reserve markets. The RES dispatch follows price incentives within specific technical and operational degrees of freedom. The feed-in will occur as soon as the spot market price exceeds the variable cost. Some RES power plants are not flexible and cannot change their feed-in.
Battery storages
Battery energy storage systems (BESS) include, for example, the following stationary facilities and mobile applications.
- Automotive batteries
- Charging stations/Grid-to-Vehicle (G2V)
- Charging stations/Vehicle-to-Grid (V2G)
- Electric vehicle batteries
- Hybrid power systems with batteries
- Prosumer-scale batteries
- Utility-scale batteries
Battery storages can be active at the spot and frequency reserve markets. The battery dispatch follows price incentives within specific technical and operational degrees of freedom. Discharging will occur at higher spot prices and charging at lower spot prices.
Hydro power plants
Hydro power plants are example following facilities.
Following image depicts the hydro power plant basis topology. Each hydro power plant is a hydro network and consists of at least one upper reservoir, one lower reservoir, and one turbine or one pump. A reservoir can be a dam, lake or constructed reservoir.
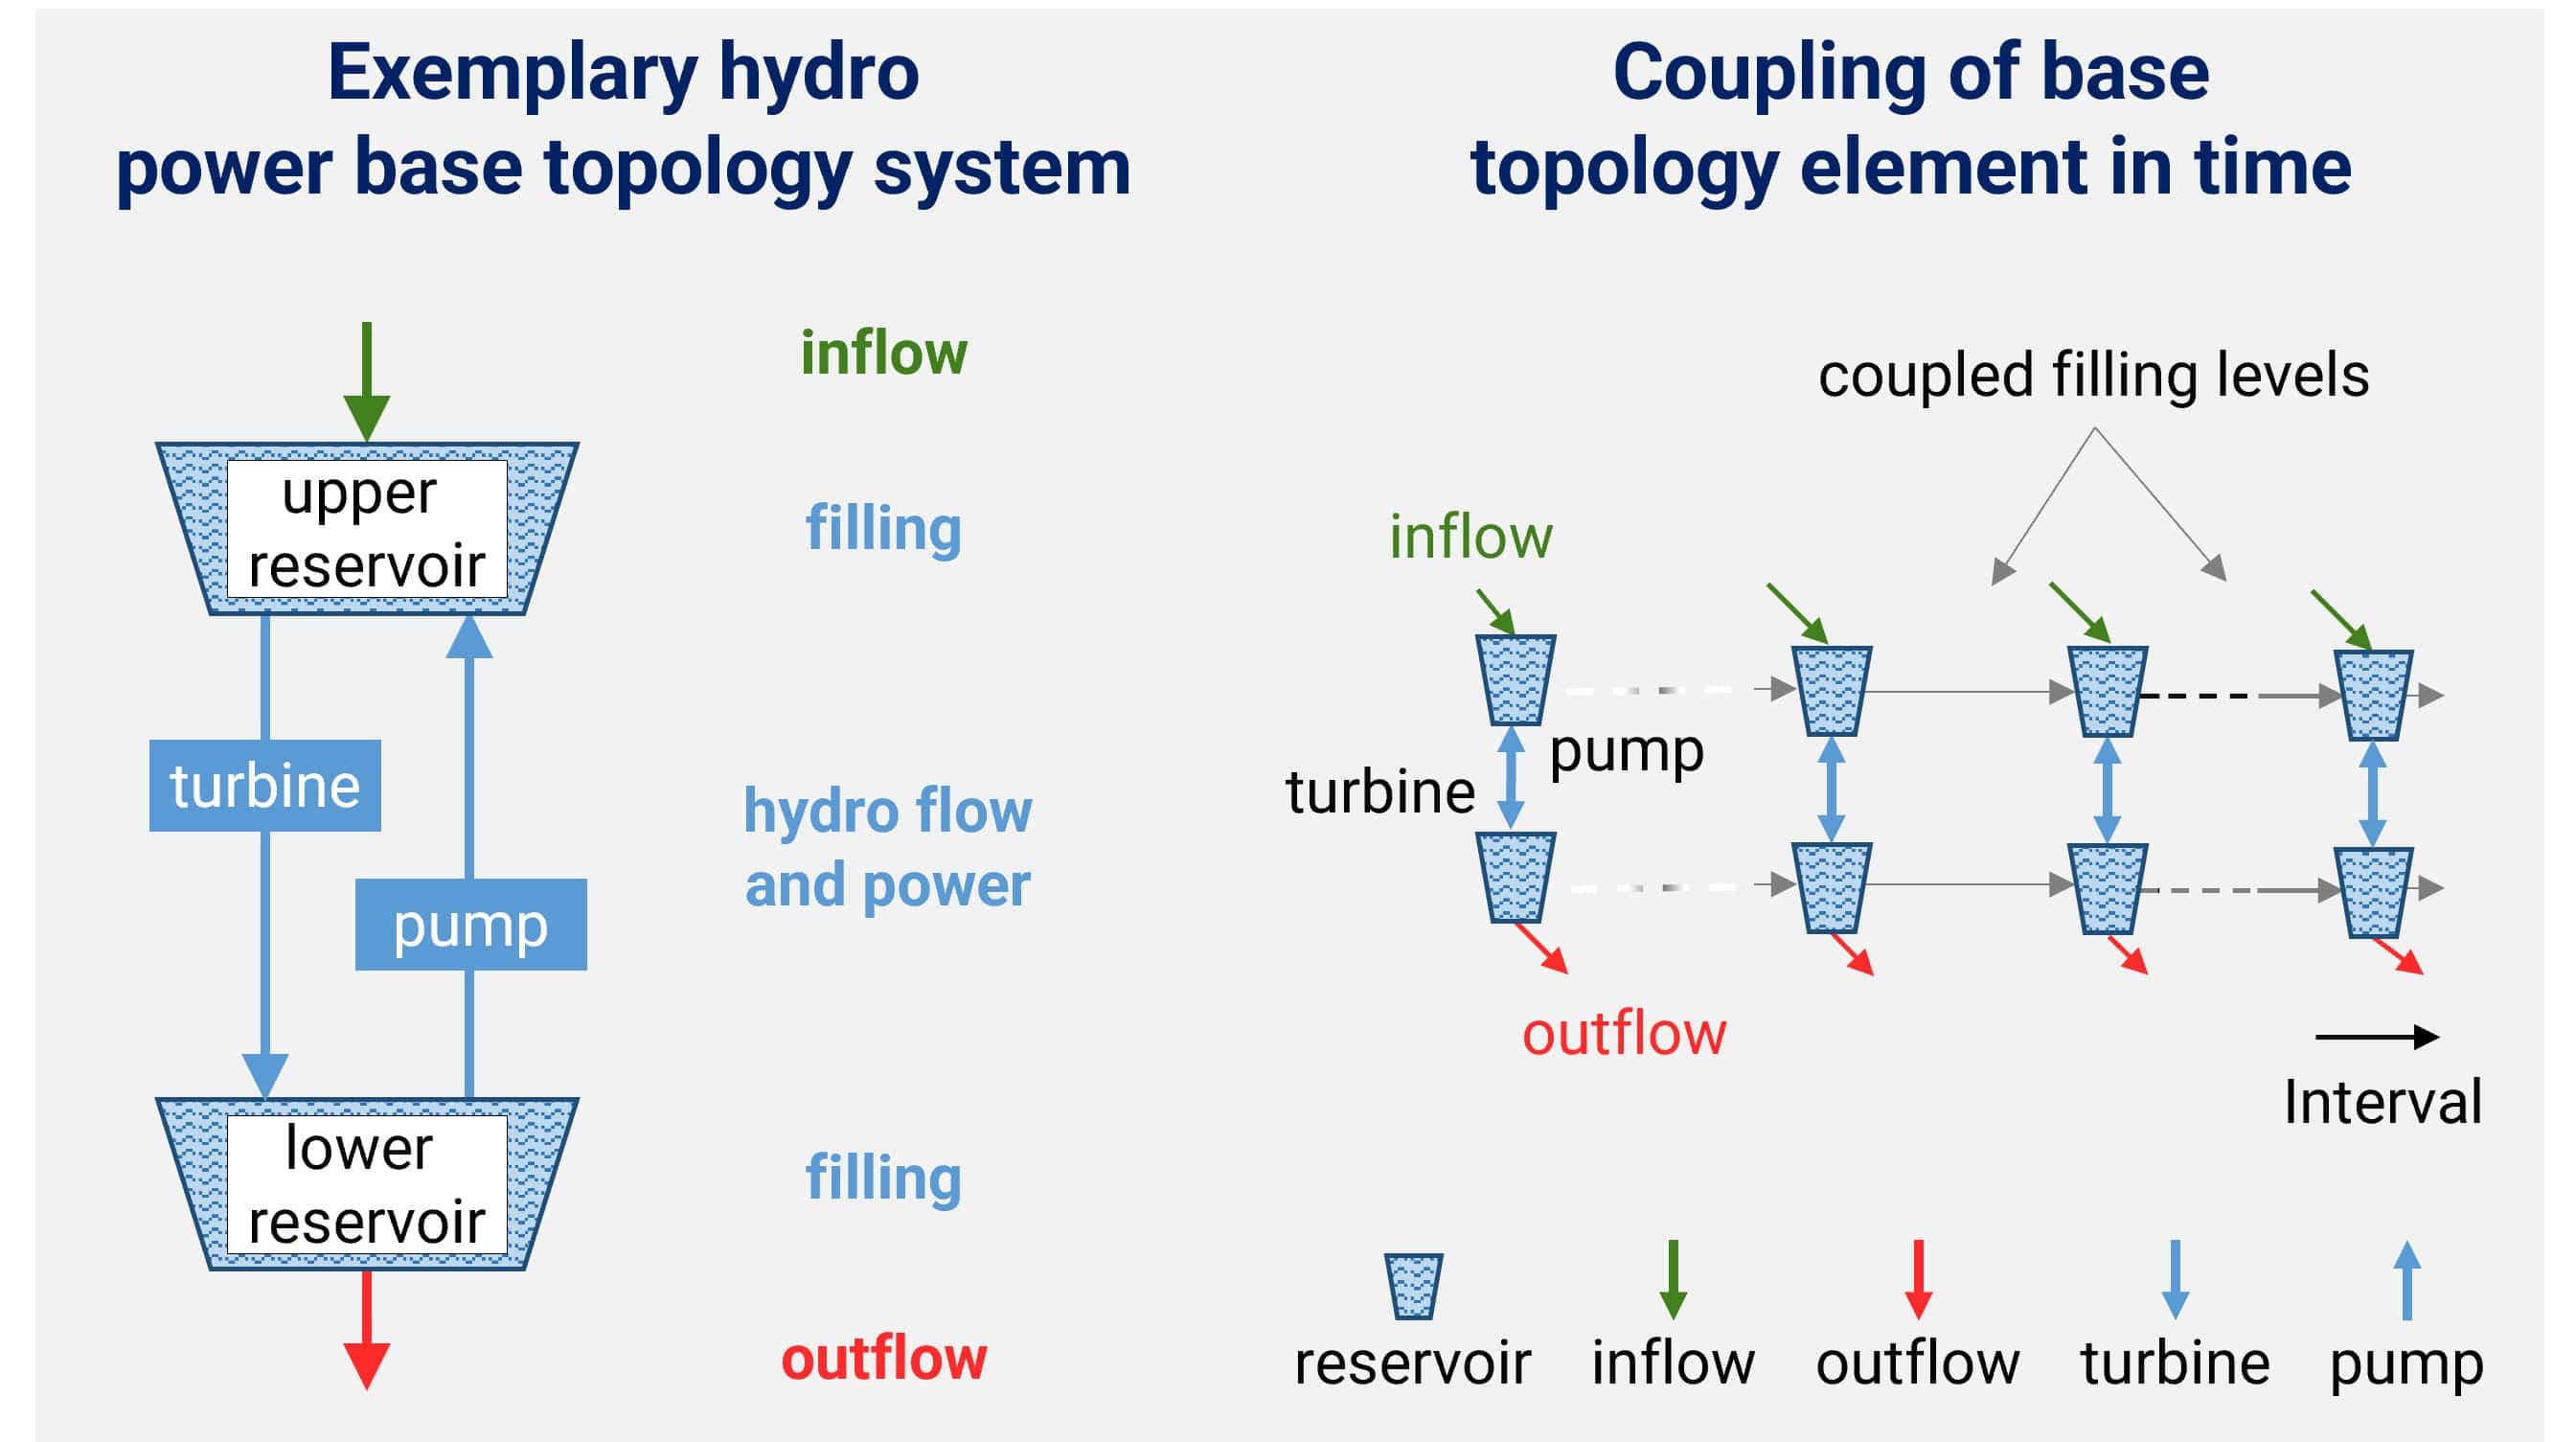
Hydro networks carry flows through turbines and pumps between reservoirs. Hydro power cascades link a series of reservoirs with turbines. Turbines, pumps, and reservoirs are static facilities. Reservoirs can have significant inflows due to precipitation and snowmelt. Hydro flows are linked in turbines to electricity generation and in pumps to electricity consumption. Hydro reservoirs lying above lower reservoirs enable storing water as potential energy depending on the height difference.
Hydro power plants can be active at the spot and frequency reserve markets. The hydro power dispatch follows price incentives within specific technical and operational degrees of freedom. Turbining will occur at higher spot prices and pumping at lower spot prices.
Thermal power plants
Thermal power plants can be fueled for example with following energy sources.
Following image depicts the influences on the thermal power plant dispatch. Each thermal power plant consists of at least one component.
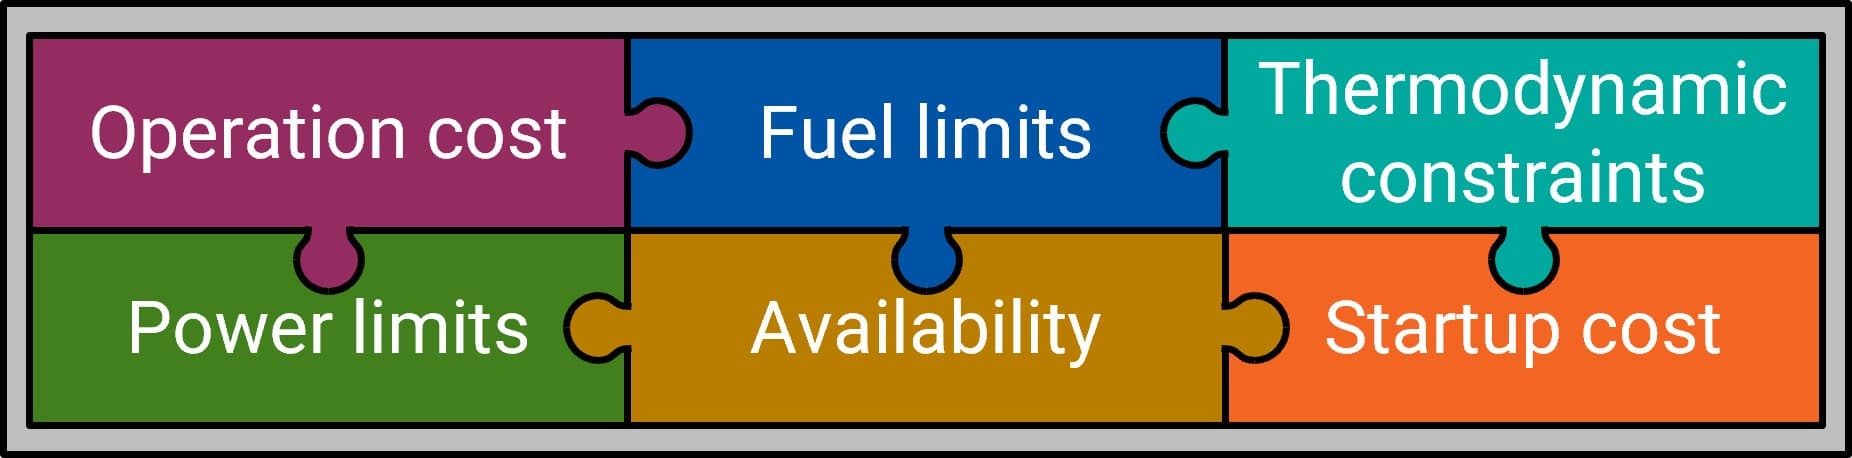
Thermal power plants can be active at the spot and frequency reserve markets. The thermal power plant dispatch follows price incentives within specific technical and operational degrees of freedom. They are generating, as soon as the spot market revenues cover their variable generation costs.
Interconnectors
Following image depicts exchange capacity types that define possible imports and exports between bidding zones.
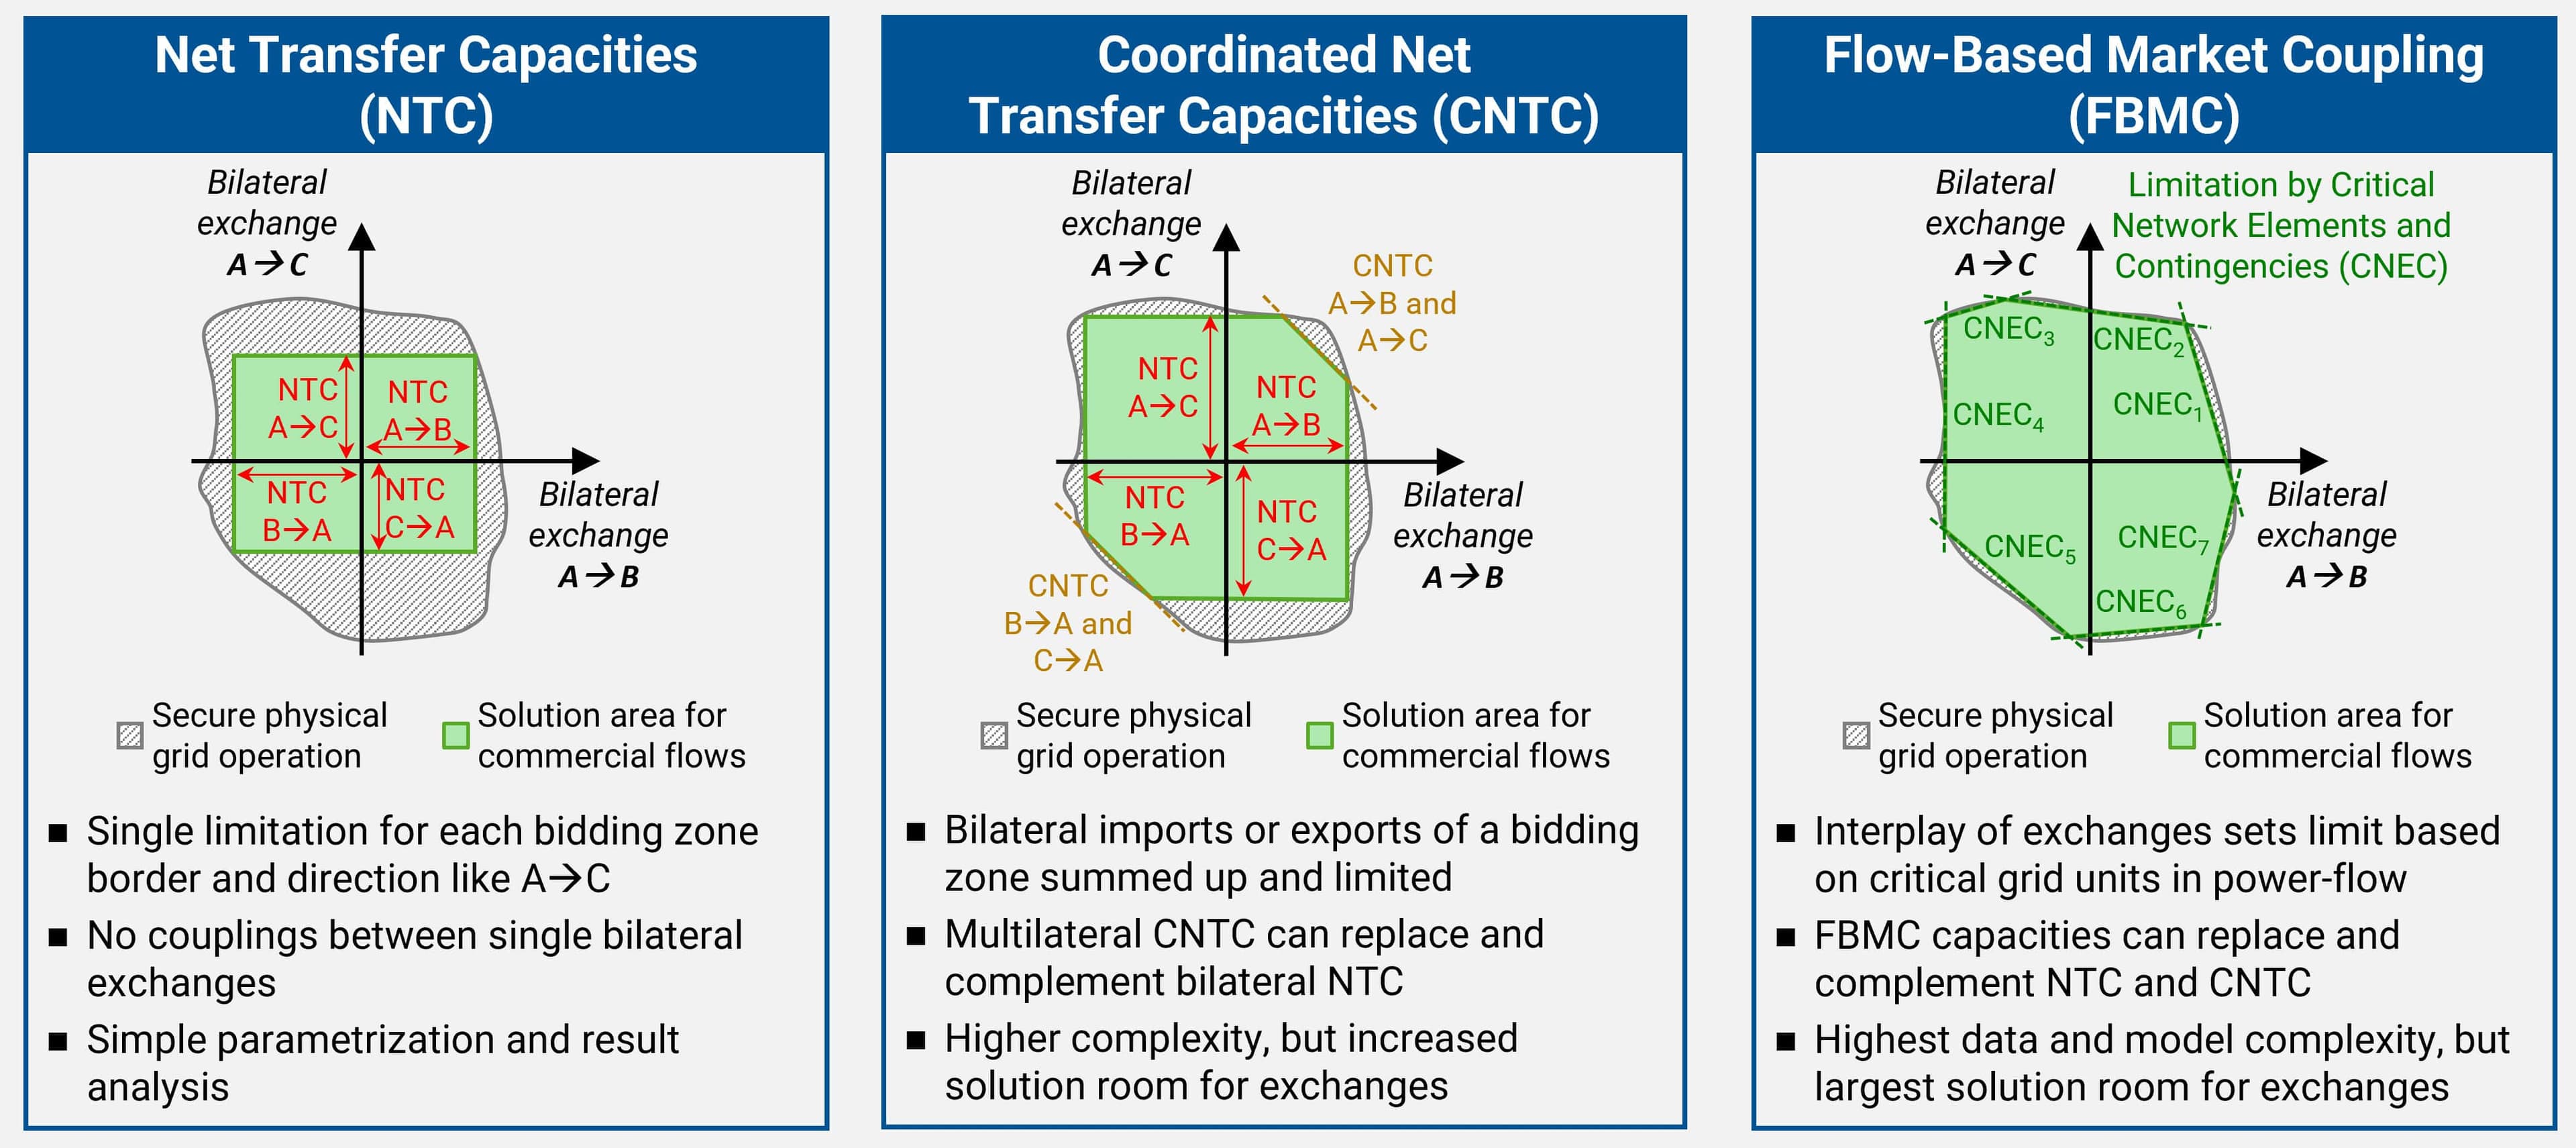
Net transfer capacities (NTC) represent unidirectional exchange limits between two bidding zones. Coordinated net transfer capacities (CNTC) build on this by applying a multilateral approach, restricting the combined imports or exports from multiple bidding zones into a single bidding zone. NTC and CNTC can coexist with the constraints established by critical network elements and contingencies (CNEC) in an flow-based market coupling (FBMC). CNEC capture how combined power flows affect exchange capacities, taking into account congestion relief from counteracting exchanges. Additionally, reserve exchange capacities may be available concurrently, adding reserves to the market coupling.
Exchange capacities enable maximizing the total social welfare at connected bidding zones (see market coupling).
Interaction
This section explains how markets and technologies interact.
Markets and technologies
The electricity wholesale market is a system of systems. The overall system is defined by demand, supply, and exchanges formed by the bids of market participants. These bids reflect the opportunity costs based on the operational flexibility of physical assets for generation, consumption, and storage, each forming a distinct subsystem. These subsystems are interconnected not only through physical infrastructure but also across different electricity markets and timeframes.
Spot and balancing schedules
Once generation power is committed to the spot market, it cannot be used or sold again, for example, for positive aFRR. Therefore, spot and balancing schedules must not only comply with technical and operational restrictions, such as maximum power and prequalification, but also be consistent with each other to avoid any double-counting.
Spot demand and renewable feed-in
The spot market demand and the feed-in from renewable energy sources can respond to market prices only through demand-side response and by reducing feed-in. The remaining residual demand and dispatch flexibility must be covered by other generators, storage systems, and interconnectors.
Electrolyzer dispatch and hydrogen demand
The electrolyzer dispatch depends on the flexibility downstream the hydrogen generation. In reality, three modes of operation can be distinguished:
- Price: Electrolyzers operate purely based on electricity market incentives. If sufficient hydrogen storage and transport capacity is available, hydrogen production becomes fully flexible. In this mode, electrolyzers run whenever electricity spot prices fall below the hydrogen opportunity cost.
- Volume: Electrolyzers must produce a target amount of hydrogen over a defined period to satisfy a cumulative demand. While the exact timing of operation is flexible, the total hydrogen output must meet the demand volume over time.
- Matching: Electrolyzers directly follow hydrogen consumption over intervals or timeranges. This enforces a 1:1 match between hydrogen production and hydrogen demand, making the electrolyzer operation inflexible.
These modes can be combined in practice, reflecting varying levels of operational flexibility of electrolyzers.
Flexible renewables
Demand-side response may include flexible generation units, such as dump energy and reserve provision from renewable energy sources. For supply-side applications, demand is represented with inverted power signs: an increase in consumption corresponds to a decrease in generation, and a decrease in consumption corresponds to an increase in generation.
Mustrun, outage and revision
Mustrun, outage, and revision events are simultaneously valid and handled consistently across component types. Events that overlap in time are restricting in combination. This applies uniformly to demand-side response consumers, battery storages, hydro power plants, thermal power plants, and grid capacities. This function is illustrated in the following figure.

Emission control mechanisms
Emission control mechanisms can be implemented in reality using two main approaches:
- Emission tax (price-setting): An emission tax assigns a fixed cost to each unit of emissions (e.g., CO₂-equivalent), making it more expensive to pollute. This pricing approach encourages emission reductions by making fossil fuel-based generation less economically attractive. In the electricity market, thermal plant operators face higher production costs because they have to pay the tax for every unit of emissions they produce.
- Cap-and-trade (volume-limiting): A cap-and-trade system sets an overall limit (cap) on emissions and distributes a corresponding number of emission allowances. These allowances can be bought and sold (trade), and their limited supply leads to a market price. Thermal plant operators need to acquire enough allowances to cover their emissions. The cost of purchasing these allowances adds to their operating expenses, creating a financial incentive to reduce emissions.
These two mechanisms can exist together in reality.
The figure below illustrates the schematic differences between price-setting and volume-limiting.

Dispatch vs. Investment
The equilibrium of electricity wholesale markets is determined by the interplay of supply and demand, reflected in the market clearing price and volume. This process drives short-term facility dispatch decisions, which, in turn, shape long-term investment and decommissioning strategies for new and existing facilities. Given the significant financial commitment required for facilities participating in the wholesale market, these investment decisions rely on thorough economic viability assessments (EVA).
EVA rely on projections of future operational revenues and costs, which are primarily influenced by anticipated short-term dispatches and electricity prices. Forecasted cash flows, covering market revenues, operating expenses, and investment costs for a given facility option, are evaluated using financial metrics. Relevant financial metrics comprise:
The cumulative effect of all investment decisions shapes future capacities in the long run, thus defining the long-term market equilibrium.
Units
The electricity market is based on power and work amounts, making definitions and units essential for its understanding. Energy can be defined with following SI units:
- Joule (J): Joule is the unit of energy that equals one watt-second (Ws).
- Watt-hour (Wh): Watt-hour (Wh) is a unit of energy that is commonly used in household meters in the form of kilowatt-hours (kWh) and in electricity wholesale markets in megawatt-hours (MWh). One watt-hour (Wh) equals the amount of electrical energy expended by a one-watt load (W) drawing power for one hour (h).
Both, joules (J) and watt-hours (Wh) are commonly used units for measuring electric energy. For example, a computer consumes power (measured in watts) over a specific duration (measured in seconds), resulting in a certain amount of energy used. The watt is a unit of energy per time, while the hour is a unit for measuring time. When watts are multiplied by hours, the resulting unit of energy is called the watt-hour. This represents the amount of power (in watts) consumed over a given number of hours.
In the context of the electricity wholesale market, the following table presents important constants.
| Value | Definition | Description |
|---|---|---|
| 8760 | Hours of non-leap calendar year | Years are used by default as scenario time ranges so it allows to check if a series of hourly values represents a complete year or has data missing |
| 8784 | Hours of leap calendar year | Leap years can be used as scenario time ranges so it allows to check if a series of hourly values represents a complete leap year or has data missing |
| 168 | Hours of calendar week | Weeks represent one main load-cycle of some storages |
| 3.6 | Factor to convert MWh to GJ with 100 % efficiency | 1 megawatt-hour equals 3.6 gigajoules so that this conversion allows to compare and check fuel prices (in EUR/GJ) and electricity prices (in EUR/MWh) |
Model derivation
Based on the fundamentals analyzed here, the following model, simulation, and procedure are available.